Water enters our warehouse. It would go to 1.8 metres high.[/caption] Two months later, with another severe rain event in South East Queensland, we are slightly better informed due to our own data gathering. Did you know that the Bureau of Meteorology (BOM) provides River Height plots enabling you to check the current river levels? I will explain here how you can find them. Even now, after the painful lessons handed out in February, there is little communication from the authorities about how the weather predictions may translate on the ground. In my opinion, this is because the authorities have not invested in better flood modelling and targeted education programs. The economic and emotional consequences of floods are enormous, yet a comparatively tiny amount is spent on measures that could help reduce those losses. Brisbane-based FloodMapp is one example of what is possible.
How are flood levels used?
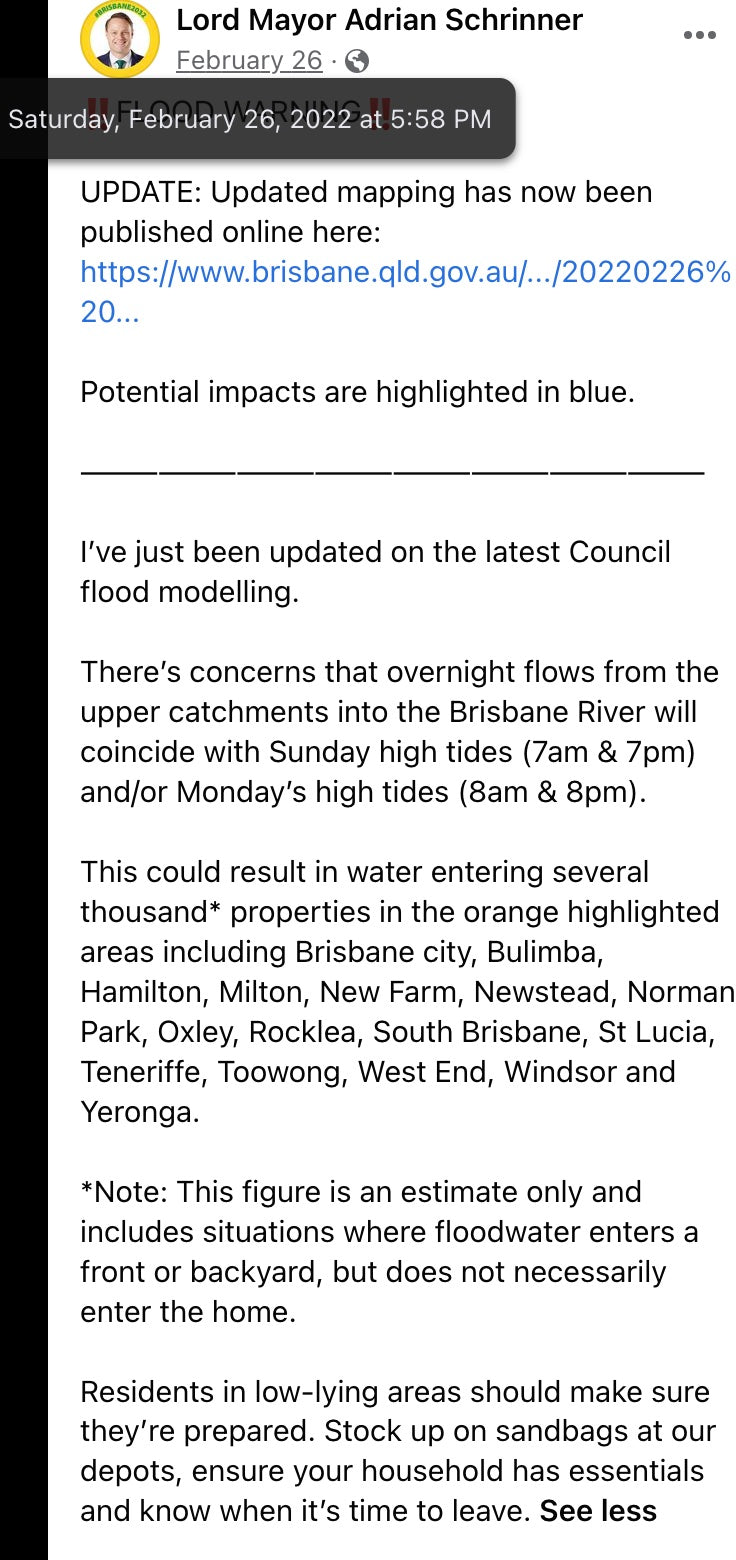
Back in February, we mistakenly relied on the Brisbane City Council (BCC) Early Warning Alert Service and other measures it said were enacted post the 2011 floods. The Council promoted this service as though it could be relied upon, when in fact the contents were not effective and created a false sense of security for many. For example, here are the alerts I received hours before our inundation. They contain the exact words of many others received previously for our average storm. Rainfall, but no flood? There was no further enlightenment when I clicked through to the link in those texts. The Saturday, 26 Feb 4:29 pm text led to this notice that covers an area from Kingaroy to the Sunshine Coast and the NSW border! (a) This is BOM data without interpretation of likely outcomes, other than "flash flooding" that always appears; and (b) it ought to focus on Brisbane.
  Meanwhile, earlier at 3:08 pm, the BOM had already issued a MODERATE flood level warning for Brisbane!
  For those with expert knowledge around the Brisbane River and floods, a MODERATE level warning should have activated alarm bells. However, most residents did not know that a Moderate flood alert had been issued; and, for those who did, there's no idea how high that may reach in their location.
What is a Minor, Moderate, or Major flood level in Brisbane?
The height of the Brisbane River is impacted by its chief tributaries the Stanley and Bremer rivers and Lockyer Creek, plus many smaller creeks, water released from the Wivenhoe Dam, the tide, and storm water flow. The BOM plots river height data all over Australia and you can find the Queensland river heights here. On these graphs, you'll see what is considered Minor, Moderate, and Major levels at points along a river. For Brisbane, click through to the 'Brisbane, Pine, Caboolture Rivers and tributaries' and find the stations nearest you. Our warehouse in Milton is located between the St Lucia and Port Office stations. It's also interesting to look at the Brisbane River at Lowood Pump station, the first station to register the impact of water released from the Wivenhoe Dam, and at the Moggill station, the first to show the impact of water entering from the Bremer River.What level was the February flood in Brisbane?
Below are the river height plots for the three day-period our warehouse was inundated. The purple arrow points to around 1 am on Sunday, 27 February, when water entered our warehouse. The first is the Port Office station plot, and the second is St Lucia. At that time, the height downstream at the Port Office was only at the Minor green line level, while at the station upstream from us, it had breached what is considered a Moderate level.
 A key question: Why did those responsible for watching these river heights not hit the panic button when the line kept rising after midday on Saturday? Or even at 6pm on Saturday? The authorities also knew that we were amid the most extraordinary rainfall dumping directly on Brisbane (80% of the city's average annual rainfall fell in a few days); and that backflow prevention devices may be closed.2 The BCC and State Government should have used every means to alert that MAJOR flooding was possible. Just six hours' notice could have saved many millions of dollars of losses. That said, without real-time flood modelling that takes into account rainfall and topography, we would still have no idea of what it would mean for the water height in homes and businesses.
May 2022 rain event
We recently experienced another severe rain event, and the river rose again. On 14 May, the Port Office station once again reached the Minor green line (the same height it did in February when water entered our warehouse), and yet, on our street in Milton there was no sign of any water pooling! So, clearly, it also depends on what is happening in the immediate catchment with rainfall and overland storm water flow.

Does this help for future?
Awareness of the live River Height Plots assisted us through the recent event, as we were able to monitor what was happening with the river rather than rely on messages from the authorities. I also believe that had we known about and been watching this Brisbane River height plot on 26 February, we would have concluded that the water was likely to reach a very high level in our warehouse and moved everything out that we had time to! I hope that this resource will also help you keep an eye on river heights wherever you live. And, I hope that all levels of government will work together and invest in technology that will give flood impact predictions that individual citizens can access themselves real-time, before the January 2023 flood season!
 Sources: (1) The Brisbane City Council official review by Paul de Jersey. (2)